http://www.batonrougerealestatetrends.net/ – Greater Baton Rouge Area GBRMLS Monthly Observations for September 2010. Baton Rouge Area Real Estate 2010 Home Sales Down 25% From September 2009!

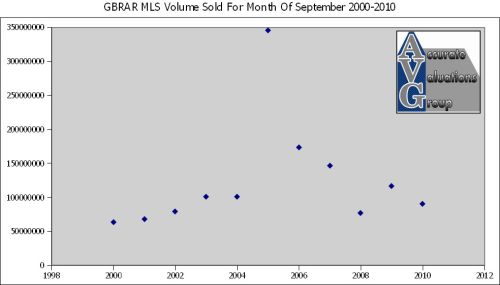
 Home sales in September continued to decline, declining 3% to $89,770,774 in September from August’s $92,501,330. This is a decline of 18% from last September, at $116,614,434. As we head into the seasonally weaker part of the year, it is distressing to point out that this is the worst sales level for September in the last 8 years by a large margin with the exception of September 2008 and that decline was only due to Hurricane Gustav interfering with loan closings. Source: Baton Rouge Trends Dot Com.
NOTE: This report, with the paragraph above, may be different that others recent reports because I have included “Other” MLS areas.
NOTE: This report, from this section below, may be different that others recent reports because I have included “West Baton Rouge” MLS Area 70, not just the 3 Parish areas of East Baton Rouge, Ascension and Livingston.
Total Sales Unchanged, But Off 25% From September 2009. Total unit sales were unchanged at 441 in September and 441 in August. However, this is a 25% reduction from September 2009 at 587. Of the 441 September sales, 104 were new homes and 337 were existing homes. New home sales improved 7% to 104 homes this month from 97 in August, an increase of 7 units. Existing home sales declined slightly from 337 homes in September from 346 last month, a difference of 9 homes or -2.6%. NOTE: Based on all price ranges within ASC, EBR, LIV and WBR for Property Types: DSF, ASF, PRC and PRA.
Majority of GBR Home Sales Under $200,000. Of the 441 September sales, only 22 of them were over $400,000 or approximately 5% of the market. There were 288 sales under $200,000 or 65% of market. And, there were 105 sales between $200,000 to $300,000 or approximately 24% of market.
Inventory Decreased Slightly. Inventory decreased slightly from August 2010 at 4461 to 4369 in September, a decrease of 92 or -2%. However, the inventory has increased from 3974 in September 2009 to 4369 in September 2010, an increase of 395 homes or +10%. Inventory started January 2010 at 3,583 and has continued to rise for most of 2010 with August of 4,461 being the highest inventory level of 2010.
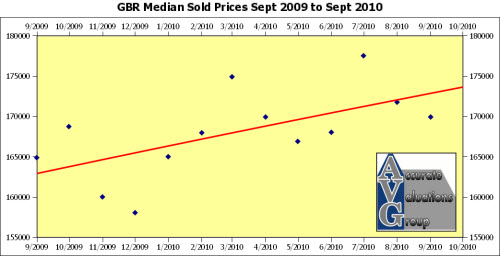
Absorption Rate Improved Slightly. Absorption for All homes in September showed 9.9 Months Inventory, which was a slight improvement from August 2010 showing 10.1 months of supply. This is much worse than the 6.8 months of supply last year at this time. Greater Baton Rouge area Average Days on Market for All homes was 89 compared to last month at 85. Average sales price for All Sold homes decreased to $194,941 from $199,289 last month. However, in January 2010, the average sales price was $188,188, so the average sales price has increased in 2010. Median sales price for All Sold homes decreased to $169,900 from $171,750 last month. However, in January 2010, the median sales price was $165,000, so the median sales price has increased overall for 2010. The twelve month moving median price line for both New and Existing homes is heading upward, reflecting stable home price support.
 High End Homes Market Appears Near Solid Support, Most Solid Within East Baton Rouge Parish. From 9/1/08 to 9/30/09, MLS reports 298 sales versus 294 sales 9/1/09 to 9/30/10, which is only a decrease of -4 sales or -1.3%. Average Sold Price for the 2009/2010 period is $539,650 compared to $548,036 for the 2008/2009 period. Median Sold Price for the 2009/2010 period is $500,000 compared to $495,700 for the 2008/2009 period. Average sold price per sq. ft. is $157.89/sf versus $159.43/sf for the 2008/2009 period. Average days on the market is 122 days versus 140 days in the 2008/2009 period. So, while the average sold price per sq. ft. is down $1.54/sf, and average sold price is down approx. $8,400, the median sales price has increased by $4,300 and the days on the market has improved.
Yes, There Are Certainly Exceptions! Copper Mill in Zachary is one example where the average sold prices were $161/sf in 2007, $158/sf in 2008, $157/sf in 2009 and $147/sf in 2010 based on 13 sales. That’s a $10/sf drop since 2009. Plus, the days on the market for the 13 sales were: 336, 850, 20, 274, 4, 393, 252, 1082, 50, 344, 197, 54 and 2. Renaissance in Prairieville is another example where the average sold prices were $137/sf in 2007, $141/sf in 2008, $133/sf in 2009 and $129.24/sf in 2010 based on 7 sales. That’s a -$4/sf difference between 2009 and 2010. And, MLS reports the average days on the market were 417 in 2009 and 252 in 2010. Actually, upon closer examination of total days on market, the actual continuous days on market were: 231, 1, 4, 561, 692, 1025 and 302. Greystone Golf in Denham Springs has only had 2 sales in 2010 averaging $142/sf and 6 sales in 2009 averaging $146/sf, a $4/sf decline. NOTE: For this paragraph, this includes all price ranges within these high end subdivisions.
High End Homes Market Absorption Rate Appears To Be Improving! The numbers of high end home listings has declined just slightly from 445 for September 2009 and 424 for September 2010. In September 2009, the Months Inventory showed 23.42 months. In September 2010, the Months Inventory showed 21.2 months and in August 2010 it was 19.4 months. Certainly, the market for homes requiring “Jumbo” loans remains slower in the overall Greater Baton Rouge market.
High End Homes Market NOTE: Parameters were $400,000 to $1,000,000, all price ranges within ASC, EBR, LIV and WBR for Property Types: DSF, ASF, PRC and PRA.

NOTE: Data For The September 2010 GBRAR MLS Report is used with permission of the GBRMLS from dates stated above and from 1/1/2008 through 9/30/2010.